

Validate your Skills with Updated DA0-001 Exam Questions & Answers and Test Engine
Tested & Approved DA0-001 Study Materials Download Free Updated 398 Questions
CompTIA DA0-001 exam is a multiple-choice exam that consists of 90 questions. DA0-001 exam duration is 90 minutes, and the passing score is 720 on a scale of 100-900. DA0-001 exam is available in English, Japanese, and Portuguese. DA0-001 exam fees vary by location, and candidates can register for the exam through the Pearson VUE website.
Understanding CompTIA DA0-001 Exam Topics
Applying basic statistical methods
Analyzing complex datasets while adhering to governance and quality standards throughout the entire data life cycle
Mining data
Manipulating data
Visualizing and reporting data
NEW QUESTION # 130
Samantha needs to share a list of her organization's top 50 customers with the VP of sales.
She would like to include the name of the customer, the business they represent, their contact information, and their total sales over the past year.
The VP does not have any specialized analytics skills or software but would like to make some personal notes on the dataset.
What would be the best tool for Samantha to use to share this information?
- A. SAS.
- B. Microsoft Excel.
- C. Power BI.
- D. Minitab.
Answer: B
Explanation:
Microsoft Excel.
This scenario presents a very simple use case where the business leader needs a dataset in an easy-to-access form and will not be performing any detailed analysis.
A simple spreadsheet, such as Microsoft Excel, would be the best tool for this job.
There is no need to use a statistical analysis package, such as SAS or Minitab, as this would likely confuse the VP without adding any value. The same is true of an integrated analytics suite, such as Power BI.
NEW QUESTION # 131
Encryption is a mechanism for protecting data.
When should encryption be applied to data?
Choose the best answer.
- A. When data is at rest.
- B. When data is at rest, unless you are using local storage.
- C. When data is at rest or in transit.
- D. When data is in transit.
Answer: C
Explanation:
Explanation
Correct answer B. When data is at rest or in transit.
To provide maximum protection, encrypt data both in transit and at rest.
NEW QUESTION # 132
Which of the following is the correct data type for text?
- A. Float
- B. String
- C. Integer
- D. Boolean
Answer: B
Explanation:
Explanation
The correct data type for text is string. A string is a data type that represents a sequence of characters, such as letters, numbers, symbols, or spaces. A string can be enclosed by single quotes (' ') or double quotes (" ") in most programming languages. For example, 'Hello', "World", and "123" are all strings. The other options are not data types for text, but for other kinds of values. A boolean is a data type that represents a logical value, either true or false. An integer is a data type that represents a whole number, such as 1, 0, or -5. A float is a data type that represents a number with a fractional part, such as 3.14, 0.5, or -2.7. Reference: Data Types - W3Schools
NEW QUESTION # 133
Refer to exhibit.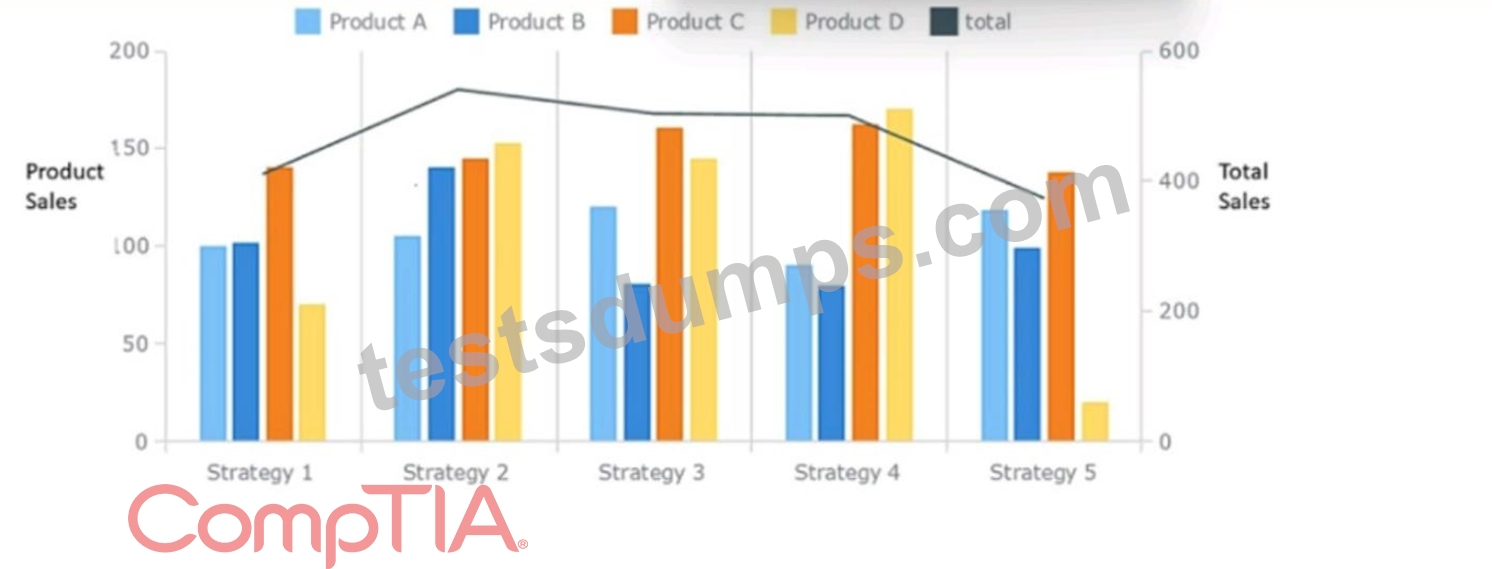
Which of the following summary statements upholds integrity in data reporting?
- A. While Strategy 2 does not result in the highest sales of Product D. over all products it appears to be the most effective.
- B. Product D should be promoted more than the other products in all strategies.
- C. Sales are approximately equal for Product A and Product B across all strategies.
- D. Strategy 4 provides the best sales in comparison to other strategies.
Answer: A
Explanation:
Answer C) While Strategy 2 does not result in the highest sales of Product D. over A summary statement that upholds integrity in data reporting should be accurate, unbiased, and supported by evidence. Option C is the only statement that meets these criteria, as it reflects the data shown in the bar graph without exaggerating or distorting it. Option C also acknowledges the limitation of the statement by using the word "appears", which indicates that there may be other factors or variables that affect the sales performance.
Option A is inaccurate, as sales are not approximately equal for Product A and Product B across all strategies. Product A has higher sales than Product B in strategies 1, 3, and 5, while Product B has higher sales than Product A in strategies 2 and 4.
Option B is biased, as it does not consider the sales of different products in each strategy. Strategy 4 provides the best sales for Product B, but not for the other products. Strategy 5 has the highest total sales across all products, as shown by the black line graph.
Option D is unsupported by evidence, as it does not explain why Product D should be promoted more than the other products in all strategies. Product D has the lowest sales among all products in strategies 1, 3, and 4, and only slightly higher sales than Product C in strategies 2 and 5.
NEW QUESTION # 134
When taking the test at home, how much extra time is allowed compared to the in-person test?
- A. 15 minutes
- B. 10 minutes
- C. None.
- D. 30 minutes
Answer: C
NEW QUESTION # 135
A data analyst is creating a report that will provide information about various regions, products, and time periods. Which of the following formats would be the MOST efficient way to deliver this report?
- A. A workbook with multiple tabs for each region
- B. A static report with a different page for every filtered view
- C. A dashboard with filters at the top that the user can toggle
- D. A daily email with snapshots of regional summaries
Answer: C
Explanation:
A dashboard with filters at the top that the user can toggle would be the most efficient way to deliver this report, because it allows the user to customize the view and explore different combinations of regions, products, and time periods. A workbook with multiple tabs for each region would be cumbersome and repetitive. A daily email with snapshots of regional summaries would not provide enough detail or interactivity. A static report with a different page for every filtered view would be too long and hard to navigate. References: CompTIA Data+ Certification Exam Objectives, page 14
NEW QUESTION # 136
A data analyst needs to present the results of an online marketing campaign to the marketing manager. The manager wants to see the most important KPIs and measure the return on marketing investment. Which of the following should the data analyst use to BEST communicate this information to the manager?
- A. A summary with statistics, conclusions, and recommendations from the data analyst
- B. A spreadsheet of the raw data from all marketing campaigns and channels
- C. A sell-service dashboard that allows the manager to look at the company's annual budget performance
- D. A real-time monitor that allows the manager to view performance the day the campaign was launched
Answer: A
Explanation:
The option that the data analyst should use to best communicate the information to the manager is a summary with statistics, conclusions, and recommendations from the data analyst. A summary is a concise and clear way of presenting the main findings and insights from the data analysis report. A summary should include relevant statistics that support the conclusions and recommendations from the data analyst. A summary should also highlight the most important KPIs and measure the return on marketing investment in relation to the objectives of the online marketing campaign. The other options are not as effective as using a summary to communicate the information to the manager, as they either provide too much or too little information or do not address the manager's needs or expectations. A real-time monitor may provide too much information that can be overwhelming or distracting for the manager who wants to see only the most important KPIs and measure the return on marketing investment. A self-service dashboard may provide too little information that can be insufficient or unclear for the manager who wants to see some guidance and interpretation from the data analyst. A spreadsheet of raw data may provide irrelevant or inaccurate information that can be confusing or misleading for the manager who wants to see some analysis and insights from the data analyst. Reference: [How to Write an Executive Summary for Your Data Analysis Report - Towards Data Science]
NEW QUESTION # 137
A data analyst has been asked to derive a new variable labeled "Promotion_flag" based on the total quantity sold by each salesperson. Given the table below: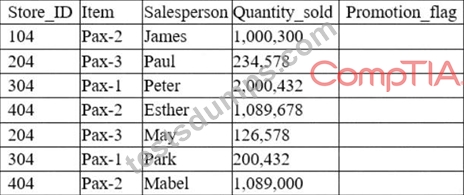
Which of the following functions would the analyst consider appropriate to flag "Yes" for every salesperson who has a number above 1,000,000 in the Quantity_sold column?
- A. Aggregate
- B. Date
- C. Mathematical
- D. Logical
Answer: D
Explanation:
A logical function is a type of function that returns a value based on a condition or a set of conditions. For example, the IF function in Excel can be used to check if a certain condition is met, and then return one value if true, and another value if false. In this case, the data analyst can use a logical function to check if the Quantity_sold column is greater than 1,000,000, and then return "Yes" if true, and "No" if false. This would create a new variable called Promotion_flag that indicates whether the salesperson has sold more than
1,000,000 units or not. References: CompTIA Data+ Certification Exam Objectives, Logical functions (reference)
NEW QUESTION # 138
An analyst needs to join two tables of data together for analysis. All the names and cities in the first table should be joined with the corresponding ages in the second table, if applicable.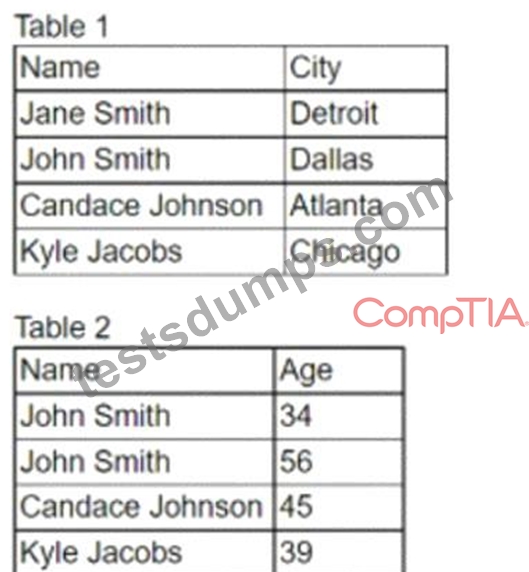
Which of the following is the correct join the analyst should complete. and how many total rows will be in one table?
- A. LEFT JOIN. four rows
- B. INNER JOIN, two rows
- C. OUTER JOIN, seven rows
- D. RIGHT JOIN. five rows
Answer: A
Explanation:
The correct join the analyst should complete is B. LEFT JOIN, four rows.
A LEFT JOIN is a type of SQL join that returns all the rows from the left table, and the matched rows from the right table. If there is no match, the right table will have null values.A LEFT JOIN is useful when we want to preserve the data from the left table, even if there is no corresponding data in the right table1 Using the example tables, a LEFT JOIN query would look like this:
SELECT t1.Name, t1.City, t2.Age FROM Table1 t1 LEFT JOIN Table2 t2 ON t1.Name = t2.Name; The result of this query would be:
Name City Age Jane Smith Detroit NULL John Smith Dallas 34 Candace Johnson Atlanta 45 Kyle Jacobs Chicago 39 As you can see, the query returns four rows, one for each name in Table1. The name John Smith appears twice in Table2, but only one of them is matched with the name in Table1. The name Jane Smith does not appear in Table2, so the age column has a null value for that row.
NEW QUESTION # 139
Which one of the following in NOT a common data integration tool?
- A. XSS
- B. ETL
- C. ELT
- D. APIs
Answer: A
Explanation:
Cross-site Scripting (XSS) is a security vulnerability usually found in websites and/or web applications that accept user input.
XSS is a client-side vulnerability that targets other application users, while SQL injection is a server-side vulnerability that targets the application's database. How do I prevent XSS in PHP? Filter your inputs with a whitelist of allowed characters and use type hints or type casting.
NEW QUESTION # 140
A data analyst needs to present the results of an online marketing campaign to the marketing manager. The manager wants to see the most important KPIs and measure the return on marketing investment. Which of the following should the data analyst use to BEST communicate this information to the manager?
- A. A summary with statistics, conclusions, and recommendations from the data analyst
- B. A spreadsheet of the raw data from all marketing campaigns and channels
- C. A sell-service dashboard that allows the manager to look at the company's annual budget performance
- D. A real-time monitor that allows the manager to view performance the day the campaign was launched
Answer: A
Explanation:
Explanation
The option that the data analyst should use to best communicate the information to the manager is a summary with statistics, conclusions, and recommendations from the data analyst. A summary is a concise and clear way of presenting the main findings and insights from the data analysis report. A summary should include relevant statistics that support the conclusions and recommendations from the data analyst. A summary should also highlight the most important KPIs and measure the return on marketing investment in relation to the objectives of the online marketing campaign. The other options are not as effective as using a summary to communicate the information to the manager, as they either provide too much or too little information or do not address the manager's needs or expectations. A real-time monitor may provide too much information that can be overwhelming or distracting for the manager who wants to see only the most important KPIs and measure the return on marketing investment. A self-service dashboard may provide too little information that can be insufficient or unclear for the manager who wants to see some guidance and interpretation from the data analyst. A spreadsheet of raw data may provide irrelevant or inaccurate information that can be confusing or misleading for the manager who wants to see some analysis and insights from the data analyst. Reference:
[How to Write an Executive Summary for Your Data Analysis Report - Towards Data Science]
NEW QUESTION # 141
Which of the following variable name formats would be problematic if used in the majority of data software programs?
- A. First Name
- B. First_Name_
- C. First_Name
- D. FirstName
Answer: A
NEW QUESTION # 142
Given the image below: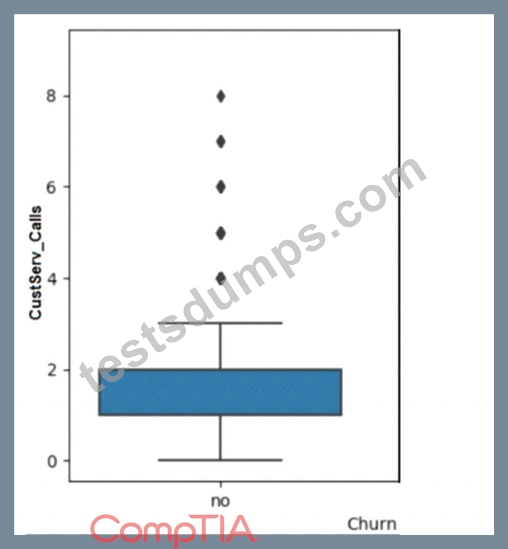
The data should be cleaned because of the presence of:
- A. non-parametric data.
- B. invalid data.
- C. outlier
- D. multicollinearity.
Answer: C
Explanation:
Explanation
The answer is A. Outlier.
Short explanation: An outlier is a data point that differs significantly from the rest of the data in a dataset. An outlier can indicate an error, an anomaly, or a rare event in the data. An outlier can affect the statistical analysis and visualization of the data, such as skewing the mean, variance, or distribution of the data.
Therefore, data should be cleaned to identify and remove or correct any outliers.
The image below shows a box plot graph with a vertical axis labeled "Customer Calls" and a horizontal axis labeled "Churn". The box plot is blue in color and the median value is around 2. There are 7 outliers above the box plot, ranging from 4 to 8.
image)
A box plot is a type of graph that can show the distribution of data values using five summary statistics:
minimum, maximum, median, first quartile, and third quartile. The box represents the interquartile range (IQR), which is the difference between the first and third quartiles. The median is shown as a line inside the box. The whiskers extend from the box to the minimum and maximum values, excluding any outliers. Outliers are shown as dots or circles outside the whiskers.
In this graph, we can see that most of the customer calls are between 0 and 4, with a median of 2. However, there are 7 outliers that have more than 4 customer calls, up to 8. These outliers may indicate some customers who have more issues or complaints than others, or some errors or anomalies in the data collection or recording process. These outliers can affect the analysis and interpretation of the customer calls and churn relationship, such as making it seem that more customer calls lead to less churn, which may not be true for the majority of the customers. Therefore, data should be cleaned to investigate and handle these outliers appropriately.
NEW QUESTION # 143
Which one of the following is a common data warehouse schema?
- A. Sphere.
- B. Snowflake.
- C. Spiral.
- D. Square.
Answer: B
Explanation:
Snowflake enables data storage, processing, and analytic solutions that are faster, easier to use, and far more flexible than traditional offerings. The Snowflake data platform is not built on any existing database technology or "big data" software platforms such as Hadoop.
NEW QUESTION # 144
Which of the following is a domain-specific language used in programming that is designed for managing data that is held in a relational data stream management system?
- A. SAS
- B. Python
- C. R
- D. SQL
Answer: D
Explanation:
SQL (Structured Query Language) is a domain-specific language used in programming, specifically designed for managing data held in a relational database management system (RDBMS), or for stream processing in a relational data stream management system (RDSMS). It is the standard language for relational database management systems. SQL statements are used to perform tasks such as update data on a database, or retrieve data from a database. Unlike languages like Python or R, which are general-purpose programming languages, SQL is tailored specifically for database management and manipulation.
References:
* ResearchGate article on SQL1.
* SpringerLink chapter on Relational Databases and SQL Language2.
* DataCamp tutorial on SQL Server Installation3.
* Wikipedia page on SQL4.
NEW QUESTION # 145
A customer list from a financial services company is shown below: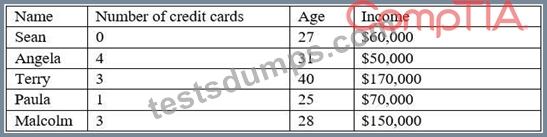
A data analyst wants to create a likely-to-buy score on a scale from 0 to 100, based on an average of the three numerical variables: number of credit cards, age, and income. Which of the following should the analyst do to the variables to ensure they all have the same weight in the score calculation?
- A. Normalize the variables.
- B. Recode the variables.
- C. Calculate the standard deviations of the variables.
- D. Calculate the percentiles of the variables.
Answer: A
Explanation:
Normalizing the variables means scaling them to a common range, such as 0 to 1 or -1 to 1, so that they have the same weight in the score calculation. Recoding the variables means changing their values or categories, which would alter their meaning and distribution. Calculating the percentiles of the variables means ranking them relative to each other, which would not account for their actual magnitudes. Calculating the standard deviations of the variables means measuring their variability, which would not make them comparable.
References: CompTIA Data+ Certification Exam Objectives, page 10
NEW QUESTION # 146
Which of the following is a KPI metric for tracking sales performance?
- A. Gross profit percentage
- B. Click-through rate percentage
- C. Customer acquisition percentage
- D. Order status percentage
Answer: A
Explanation:
Gross profit percentage is a key performance indicator (KPI) that measures the profitability of a company's sales by showing the percentage of revenue that exceeds the cost of goods sold (COGS). It is a critical metric for tracking sales performance because it directly reflects the efficiency of a company in managing its production costs and the profitability of its products. This KPI is essential for understanding the financial health of a business and making informed decisions about pricing, cost control, and sales strategies.
References:
* Sales KPIs are essential for measuring the effectiveness of sales activities and the profitability of those efforts1.
* Gross profit percentage is highlighted as a crucial metric for assessing the financial success of sales initiatives2.
* Understanding the difference between sales metrics and KPIs, and the importance of gross profit percentage as a KPI1.
* The significance of gross profit percentage in evaluating sales team performance and guiding business decisions3.
NEW QUESTION # 147
A data analyst must separate the column shown below into multiple columns for each component of the name: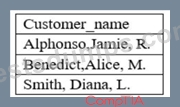
Which of the following data manipulation techniques should the analyst perform?
- A. Transposing
- B. Parsing
- C. Concatenating
- D. Imputing
Answer: B
Explanation:
Parsing is the data manipulation technique that should be used to separate the column into multiple columns for each component of the name. Parsing is the process of breaking down a string of text into smaller units, such as words, symbols, or numbers. Parsing can be used to extract specific information from a text column, such as names, addresses, phone numbers, etc. Parsing can also be used to split a text column into multiple columns based on a delimiter, such as a comma, space, or dash1. In this case, the analyst can use parsing to split the column by the comma delimiter and create three new columns: one for the last name, one for the first name, and one for the middle initial. This will make the data more organized and easier to analyze.
NEW QUESTION # 148
Exhibit.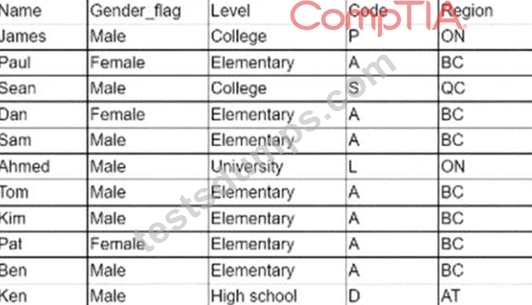
Which of the following logical statements results in Table B?
- A.

- B.

- C.

- D.

Answer: A
Explanation:
Explanation
The logical statement that results in Table B is Option D. Option D is a logical statement that uses the AND operator to combine two conditions: Name = "Tom" and Region = "BC". The AND operator returns true only if both conditions are true, otherwise it returns false. Therefore, Option D will select only the rows from Table A that satisfy both conditions, which are rows 4, 5, 6, and 7. These rows form Table B, as shown below:
Name | Gender flag | Level | College | Code | Region Tom | Male | Elementary | A | BC | BC Kim | Female | Elementary | A | BC | BC Pat | Female | Elementary | A | BC | BC Ben | Male | Elementary | A | BC | BC The other options are not correct, as they use different logical operators or conditions that do not result in Table B. Option A uses the OR operator, which returns true if either condition is true, or both. Option A will select all the rows from Table A except row 3, which does not match either condition. Option B uses the NOT operator, which returns the opposite of the condition. Option B will select all the rows from Table A except rows 4, 5, 6, and 7, which match the condition. Option C uses a different condition, Region = "ON", which does not match any row in Table A. Option C will select no rows from Table A. Reference: [SQL Logical Operators - W3Schools]
NEW QUESTION # 149
Which of the following should be accomplished NEXT after understanding a business requirement for a data analysis report?
- A. Rephrase the business requirement.
- B. Determine the data necessary for the analysis
- C. Build a mock dashboard/presentation layout.
- D. Perform exploratory data analysis.
Answer: B
Explanation:
The next step after understanding a business requirement for a data analysis report is to determine the data necessary for the analysis. This step involves identifying the data sources, variables, metrics, and dimensions that are relevant and sufficient to answer the business question or problem. This step also involves assessing the availability, quality, and accessibility of the data, and planning how to collect, clean, and prepare the data for analysis. The other options are not the next steps after understanding a business requirement, but rather subsequent steps in the data analysis process. Rephrasing the business requirement is a step that can help clarify and refine the business question or problem before determining the data necessary for the analysis.
Building a mock dashboard/presentation layout is a step that can help design and visualize the report before performing the data analysis. Performing exploratory data analysis is a step that can help explore and summarize the data before drawing conclusions and recommendations from the data. Reference: Data Analysis Process - DataCamp
NEW QUESTION # 150
Given the following graph: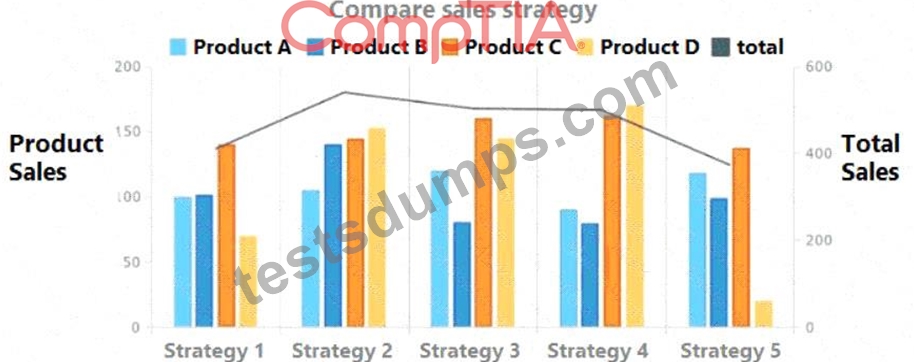
Which of the following summary statements upholds integrity in data reporting?
- A. Product D should be promoted more than the other products in all strategies.
- B. Sales are approximately equal for Product A and Product B across all strategies.
- C. Strategy 4 provides the best sales in comparison to other strategies.
- D. While Strategy 2 does not result in the highest sales of Product D, over all products it appears to be the most effective.
Answer: C
Explanation:
Strategy 4 provides the best sales in comparison to other strategies. This is because the total sales for Strategy
4 are the highest among all the strategies, as shown by the black line. The other statements are not accurate or do not uphold integrity in data reporting. Here is why:
Statement A is false because sales are not approximately equal for Product A and Product B across all strategies. For example, in Strategy 1, Product A has more sales than Product B, while in Strategy 3, Product B has more sales than Product A.
Statement C is misleading because it does not account for the difference in scale between the products. While Strategy 2 has the highest total sales among all products, it does not necessarily mean that it is the most effective for each product. For instance, Product D has very low sales in Strategy 2 compared to other strategies.
Statement D is biased because it does not provide any evidence or justification for why Product D should be promoted more than the other products in all strategies. It also ignores the fact that Product D has the lowest sales among all products in most of the strategies.
NEW QUESTION # 151
A customer survey reveals 90% positive feedback. Which of the following statistical methods would be best to utilize to determine the reliability of a data set and predict how a larger sample of customers over the same time period might respond?
- A. Calculate a low standard deviation on survey responses.
- B. Calculate the maximum range of the survey responses.
- C. Calculate a high variance on survey responses.
- D. Remove any data more than 4 standard deviation from the mean.
Answer: A
NEW QUESTION # 152
An analyst has been asked to validate data quality. Which of the following are the BEST reasons to validate data for quality control purposes? (Choose two.)
- A. Deletion
- B. Encryption
- C. Consistency
- D. Retention
- E. Transmission
- F. Integrity
Answer: C,F
NEW QUESTION # 153
An analyst modified a data set that had a number of issues. Given the original and modified versions: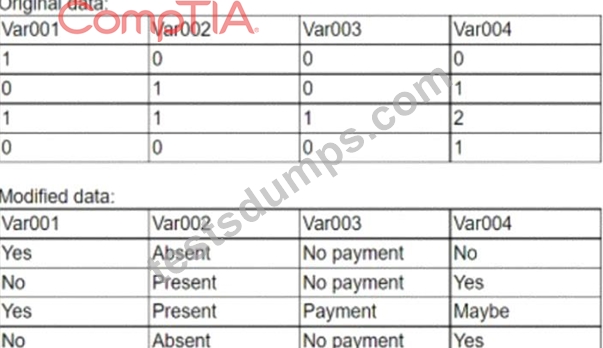
Which of the following data manipulation techniques did the analyst use?
- A. Recoding
- B. Imputation
- C. Parsing
- D. Deriving
Answer: A
Explanation:
The correct answer is B. Recoding.
Recoding is a data manipulation technique that involves changing the values or categories of a variable to make it more suitable for analysis.Recoding can be used to simplify or group the data, to correct errors or inconsistencies, or to create new variables from existing ones12 In the example, the analyst used recoding to change the values of Var001, Var002, Var003, and Var004 from numerical to textual form. The analyst also used recoding to assign meaningful labels to the values, such as
"Absent" for 0, "Present" for 1, "Low" for 2, "Medium" for 3, and "High" for 4. This makes the data more understandable and easier to analyze.
NEW QUESTION # 154
......
CompTIA DA0-001 Certification Exam is an entry-level certification, making it an excellent starting point for those who are new to data management or want to enhance their knowledge and skills in this field. It is also an excellent certification for those seeking a career change into the data management industry.
Regular Free Updates DA0-001 Dumps Real Exam Questions Test Engine: https://www.testsdumps.com/DA0-001_real-exam-dumps.html
Practice Test Questions Verified Answers As Experienced in the Actual Test!: https://drive.google.com/open?id=11VZe76ZKsk_MrrZwJ1JJNn10C0_LPjpd
